
- はじめに
- OTel Collectorアーキテクチャ
- インストール
- パイプライン設定
- Receiver詳細
- Processor詳細
- Kubernetesデプロイ
- トラブルシューティング
- デプロイ前の検証:設定ファイルとコンポーネント確認
- パイプラインの順序が生む違い
- 運用中に読むべき自己メトリクス
- 失敗パターンと切り分けの順序
- Collectorを置かない判断
- 参考資料
- まとめ
- クイズ
はじめに
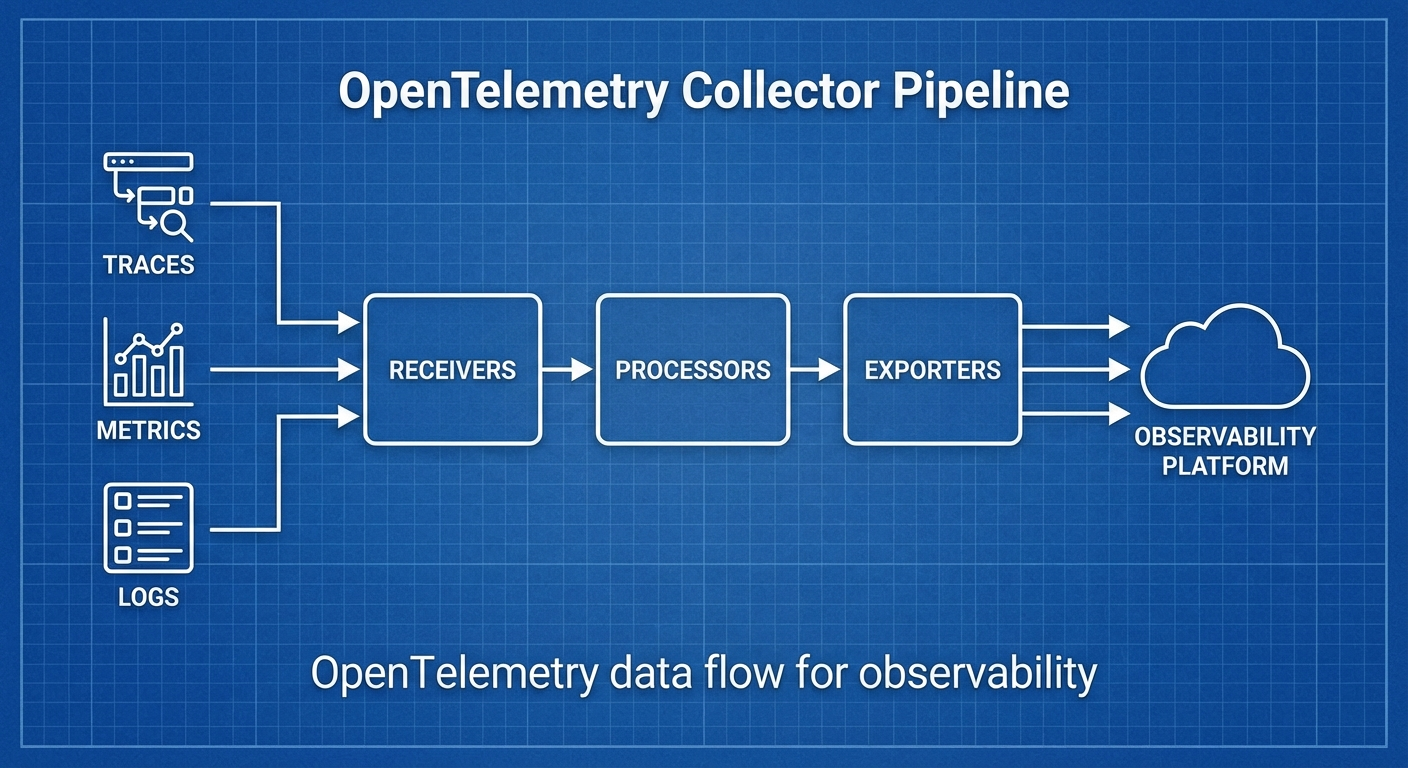
マイクロサービス環境においてTraces、Metrics、Logsを統合的に収集・処理することはObservabilityの核心です。OpenTelemetry Collectorはベンダー中立なテレメトリパイプラインで、さまざまなソースからデータを収集し、任意のバックエンドに送信します。
この記事では、OTel Collectorのアーキテクチャを理解し、プロダクション環境でのパイプライン設計を解説します。
OTel Collectorアーキテクチャ
パイプライン構造
# データフロー
# Receiver → Processor → Exporter
#
# Receiver: データ収集(OTLP、Jaeger、Prometheus、Fluentdなど)
# Processor: データ加工(フィルタリング、変換、バッチング、サンプリング)
# Exporter: データ送信(OTLP、Jaeger、Prometheus、Lokiなど)
#
# 1つのCollectorに複数のパイプラインを構成可能:
# - traces pipeline
# - metrics pipeline
# - logs pipeline
Collectorデプロイパターン
# パターン1: Agent(サイドカー/DaemonSet)
# 各ノード/Podに配置、ローカル収集

# パターン2: Gateway(中央集中)
# クラスター内の独立サービスとして配置、トラフィック集中

# パターン3: Agent + Gateway(推奨)
# Agentがローカル収集 → Gatewayが中央処理/ルーティング
インストール
Kubernetes(Helm)
# OpenTelemetry Operatorインストール
helm repo add open-telemetry https://open-telemetry.github.io/opentelemetry-helm-charts
helm repo update

# Collectorインストール(DaemonSetモード)
helm install otel-collector open-telemetry/opentelemetry-collector \
  --namespace observability \
  --create-namespace \
  --values collector-values.yaml
Docker
docker run -d --name otel-collector \
  -p 4317:4317 \
  -p 4318:4318 \
  -p 8888:8888 \
  -v $(pwd)/otel-collector-config.yaml:/etc/otelcol/config.yaml \
  otel/opentelemetry-collector-contrib:0.96.0
パイプライン設定
基本設定構造
# otel-collector-config.yaml
receivers:
  otlp:
    protocols:
      grpc:
        endpoint: 0.0.0.0:4317
      http:
        endpoint: 0.0.0.0:4318

processors:
  batch:
    timeout: 5s
    send_batch_size: 1000
    send_batch_max_size: 1500

exporters:
  debug:
    verbosity: detailed

service:
  pipelines:
    traces:
      receivers: [otlp]
      processors: [batch]
      exporters: [debug]
    metrics:
      receivers: [otlp]
      processors: [batch]
      exporters: [debug]
    logs:
      receivers: [otlp]
      processors: [batch]
      exporters: [debug]
プロダクションパイプライン
# production-config.yaml
receivers:
  # OTLP(アプリケーションSDKから送信)
  otlp:
    protocols:
      grpc:
        endpoint: 0.0.0.0:4317
        max_recv_msg_size_mib: 4
      http:
        endpoint: 0.0.0.0:4318
        cors:
          allowed_origins: ['*']

  # Prometheusスクレイピング
  prometheus:
    config:
      scrape_configs:
        - job_name: 'kubernetes-pods'
          kubernetes_sd_configs:
            - role: pod
          relabel_configs:
            - source_labels: [__meta_kubernetes_pod_annotation_prometheus_io_scrape]
              action: keep
              regex: true

  # ホストメトリクス
  hostmetrics:
    collection_interval: 30s
    scrapers:
      cpu: {}
      memory: {}
      disk: {}
      network: {}
      load: {}

  # Kubernetesイベント
  k8s_events:
    namespaces: [default, production]

processors:
  # バッチング
  batch:
    timeout: 5s
    send_batch_size: 1000

  # メモリ制限
  memory_limiter:
    check_interval: 1s
    limit_mib: 1500
    spike_limit_mib: 512

  # リソース情報の付加
  resourcedetection:
    detectors: [env, system, docker, gcp, aws, azure]
    timeout: 5s

  # K8sメタデータの付加
  k8sattributes:
    auth_type: serviceAccount
    extract:
      metadata:
        - k8s.namespace.name
        - k8s.deployment.name
        - k8s.pod.name
        - k8s.node.name

  # 不要な属性の削除
  attributes:
    actions:
      - key: http.request.header.authorization
        action: delete
      - key: db.statement
        action: hash # 機密クエリのハッシュ化

  # テールサンプリング(tracesのみ)
  tail_sampling:
    decision_wait: 10s
    num_traces: 100000
    policies:
      - name: error-policy
        type: status_code
        status_code:
          status_codes: [ERROR]
      - name: slow-policy
        type: latency
        latency:
          threshold_ms: 1000
      - name: probabilistic-policy
        type: probabilistic
        probabilistic:
          sampling_percentage: 10

  # フィルタリング
  filter:
    metrics:
      exclude:
        match_type: regexp
        metric_names:
          - 'go_.*'
          - 'process_.*'

exporters:
  # Traces → Tempo
  otlp/tempo:
    endpoint: tempo.observability.svc:4317
    tls:
      insecure: true

  # Metrics → Prometheus/Mimir
  prometheusremotewrite:
    endpoint: http://mimir.observability.svc:9009/api/v1/push
    tls:
      insecure: true
    resource_to_telemetry_conversion:
      enabled: true

  # Logs → Loki
  loki:
    endpoint: http://loki.observability.svc:3100/loki/api/v1/push
    default_labels_enabled:
      exporter: true
      job: true

  # デバッグ(トラブルシューティング用)
  debug:
    verbosity: basic

extensions:
  # ヘルスチェック
  health_check:
    endpoint: 0.0.0.0:13133

  # 自己メトリクス
  zpages:
    endpoint: 0.0.0.0:55679

  # pprof(プロファイリング)
  pprof:
    endpoint: 0.0.0.0:1777

service:
  extensions: [health_check, zpages, pprof]

  pipelines:
    traces:
      receivers: [otlp]
      processors:
        [memory_limiter, resourcedetection, k8sattributes, attributes, tail_sampling, batch]
      exporters: [otlp/tempo]

    metrics:
      receivers: [otlp, prometheus, hostmetrics]
      processors: [memory_limiter, resourcedetection, k8sattributes, filter, batch]
      exporters: [prometheusremotewrite]

    logs:
      receivers: [otlp, k8s_events]
      processors: [memory_limiter, resourcedetection, k8sattributes, attributes, batch]
      exporters: [loki]

  telemetry:
    logs:
      level: info
    metrics:
      address: 0.0.0.0:8888
Receiver詳細
OTLP Receiver
receivers:
  otlp:
    protocols:
      grpc:
        endpoint: 0.0.0.0:4317
        max_recv_msg_size_mib: 4
        keepalive:
          server_parameters:
            max_connection_idle: 11s
            max_connection_age: 30s
      http:
        endpoint: 0.0.0.0:4318
Filelog Receiver(ログファイル収集)
receivers:
  filelog:
    include:
      - /var/log/pods/*/*/*.log
    exclude:
      - /var/log/pods/*/otel-collector*/*.log
    start_at: beginning
    include_file_path: true
    operators:
      - type: router
        routes:
          - output: parse_json
            expr: 'body matches "^\\{"'
          - output: parse_plain
            expr: 'body matches "^[^{]"'
      - id: parse_json
        type: json_parser
        timestamp:
          parse_from: attributes.timestamp
          layout: '%Y-%m-%dT%H:%M:%S.%fZ'
      - id: parse_plain
        type: regex_parser
        regex: '^(?P<timestamp>\S+) (?P<level>\S+) (?P<message>.*)'
Processor詳細
テールサンプリング(重要!)
processors:
  tail_sampling:
    decision_wait: 10s
    num_traces: 100000
    expected_new_traces_per_sec: 1000
    policies:
      # エラーは100%収集
      - name: errors
        type: status_code
        status_code:
          status_codes: [ERROR]

      # 1秒以上遅いリクエストは100%収集
      - name: slow-traces
        type: latency
        latency:
          threshold_ms: 1000

      # 特定サービスは100%収集
      - name: critical-services
        type: string_attribute
        string_attribute:
          key: service.name
          values: [payment-service, auth-service]

      # 残りは5%のみ収集
      - name: probabilistic
        type: probabilistic
        probabilistic:
          sampling_percentage: 5

      # 複合ポリシー
      - name: composite-policy
        type: composite
        composite:
          max_total_spans_per_second: 1000
          policy_order: [errors, slow-traces, critical-services, probabilistic]
          rate_allocation:
            - policy: errors
              percent: 30
            - policy: slow-traces
              percent: 30
            - policy: critical-services
              percent: 20
            - policy: probabilistic
              percent: 20
Transform Processor
processors:
  transform:
    trace_statements:
      - context: span
        statements:
          # 属性の追加
          - set(attributes["deployment.environment"], "production")
          # 属性の変換
          - replace_pattern(attributes["http.url"], "password=\\w+", "password=***")
          # 条件付き処理
          - set(attributes["error.category"], "timeout") where attributes["error.type"] == "DeadlineExceeded"

    metric_statements:
      - context: datapoint
        statements:
          - set(attributes["env"], "prod")

    log_statements:
      - context: log
        statements:
          # ログ本文から情報を抽出
          - set(attributes["user_id"], ExtractPatterns(body, "user_id=(?P<user_id>\\w+)"))
Kubernetesデプロイ
Agent(DaemonSet)+ Gatewayパターン
# agent-config.yaml(DaemonSet)
apiVersion: opentelemetry.io/v1beta1
kind: OpenTelemetryCollector
metadata:
  name: otel-agent
  namespace: observability
spec:
  mode: daemonset
  config:
    receivers:
      otlp:
        protocols:
          grpc:
            endpoint: 0.0.0.0:4317
      hostmetrics:
        collection_interval: 30s
        scrapers:
          cpu: {}
          memory: {}

    processors:
      memory_limiter:
        limit_mib: 512
      batch:
        timeout: 5s

    exporters:
      # Gatewayへ送信
      otlp:
        endpoint: otel-gateway.observability.svc:4317
        tls:
          insecure: true

    service:
      pipelines:
        traces:
          receivers: [otlp]
          processors: [memory_limiter, batch]
          exporters: [otlp]
        metrics:
          receivers: [otlp, hostmetrics]
          processors: [memory_limiter, batch]
          exporters: [otlp]
---
# gateway-config.yaml(Deployment)
apiVersion: opentelemetry.io/v1beta1
kind: OpenTelemetryCollector
metadata:
  name: otel-gateway
  namespace: observability
spec:
  mode: deployment
  replicas: 3
  config:
    receivers:
      otlp:
        protocols:
          grpc:
            endpoint: 0.0.0.0:4317

    processors:
      memory_limiter:
        limit_mib: 2048
      tail_sampling:
        decision_wait: 10s
        policies:
          - name: errors
            type: status_code
            status_code:
              status_codes: [ERROR]
          - name: probabilistic
            type: probabilistic
            probabilistic:
              sampling_percentage: 10
      batch:
        timeout: 10s
        send_batch_size: 5000

    exporters:
      otlp/tempo:
        endpoint: tempo.observability.svc:4317
        tls:
          insecure: true
      prometheusremotewrite:
        endpoint: http://mimir.observability.svc:9009/api/v1/push
      loki:
        endpoint: http://loki.observability.svc:3100/loki/api/v1/push

    service:
      pipelines:
        traces:
          receivers: [otlp]
          processors: [memory_limiter, tail_sampling, batch]
          exporters: [otlp/tempo]
        metrics:
          receivers: [otlp]
          processors: [memory_limiter, batch]
          exporters: [prometheusremotewrite]
        logs:
          receivers: [otlp]
          processors: [memory_limiter, batch]
          exporters: [loki]
トラブルシューティング
自己メトリクスの確認
# Collector自己メトリクス(ポート8888)
curl http://localhost:8888/metrics | grep otelcol

# 主要メトリクス:
# otelcol_receiver_accepted_spans - 受信されたspan数
# otelcol_receiver_refused_spans - 拒否されたspan数
# otelcol_processor_dropped_spans - ドロップされたspan数
# otelcol_exporter_sent_spans - 送信されたspan数
# otelcol_exporter_send_failed_spans - 送信失敗span数
zPagesによるデバッグ
# http://localhost:55679/debug/tracez — 最近のtrace確認
# http://localhost:55679/debug/pipelinez — パイプラインステータス
デプロイ前の検証:設定ファイルとコンポーネント確認
Collectorの設定はYAMLが一行ずれただけでプロセスが起動しない。厄介なのは、その事実をクラスタでCrashLoopBackOffを見てから知ることが多い点である。パイプラインを変更する作業は、コミット前にローカルで終わらせたほうがはるかに安い。
# 設定をパースし、各コンポーネントのスキーマに合うか確認して終了する
otelcol validate --config=customconfig.yaml

# このバイナリに実際に含まれるコンポーネントと安定性レベルを出力する
otelcol components
otelcol validateはポートを開かず、データも受け取らない。設定だけを読んで終わるためCIに向く。Helmでレンダリングした ConfigMap から設定部分だけを取り出してこのコマンドに渡せば、パイプラインに存在しないプロセッサを書いた、あるいはexporter名のサフィックスを間違えたといったミスをデプロイ前に捕まえられる。
otelcol componentsはあまり知られていないが、実務ではこちらのほうが必要になる場面が多い。設定に書いたコンポーネントが実行中のバイナリに無い場合、Collectorは未知のタイプという趣旨のエラーで落ちるが、このとき多くの人はまず設定のタイプミスを疑う。しかし実際の原因はディストリビューションが違うケースのほうがずっと多い。どのコンポーネントが組み込まれているかはビルドごとに異なるため、ブログやドキュメントで見た名前をそのまま貼り付ける前に、このコマンドで存在を確認する習慣が要る。出力には安定性レベルも並ぶので、本番パイプラインがalpha段階のコンポーネントに依存していないかも同じ場所で判断できる。
環境ごとに変わる値は、設定ファイルを複数用意するのではなく環境変数の置換で処理する。Collectorはenv接頭辞を付けた置換構文をサポートし、コロンとハイフンを続ける書き方でデフォルト値を指定できる。値の中にドル記号そのものが必要な場合は、ドル記号を二回書いてエスケープする。
exporters:
  otlp/backend:
    endpoint: ${env:OTLP_ENDPOINT}
    headers:
      authorization: ${env:OTLP_TOKEN:-}
コマンドラインから個別の値だけを上書きすることもできる。ネストしたキーはコロン二つで区切って --set outer::inner=value の形で指定し、--config を複数回渡すと設定がマージされる。共通設定一式の上に環境ごとの断片を重ねる構成を、ファイルコピーなしで作れるということである。
パイプラインの順序が生む違い
ドキュメントは、パイプラインに並べたプロセッサの順序がそのままシグナルに適用される処理の順序になる、と明記している。短い一文だが運用で生む差は大きい。
memory_limiterを先頭に置く理由は、このプロセッサが後段へ流すデータ量を減らすのではなく、メモリ逼迫を検知した時点で受け取り自体を拒否し、上流へバックプレッシャーを返すからである。後ろに置くと、パースと変換でメモリを使い切ってから拒否することになり、保護の意味が失われる。
tail_samplingはbatchより前になければならない。サンプリングの判断はトレース単位で下されるが、先にバッチ化されると同じトレースのspanが別々のバッチに散らばり、判断対象が欠けた状態になる。逆にbatchはほぼ常に最後である。バッチ化は転送効率のための段階なので、その後ろに何かを足すとバッチを解いて組み直す無駄が生じる。
filterとattributesをどこに置くかはコストの問題である。捨てるデータを前で捨てるほど、後段が扱う量が減る。ただし機密情報の除去は逆に考える必要がある。k8sattributesのようにメタデータを付与するプロセッサが新しい属性を作り得るため、削除やハッシュ化はその後ろに来なければ漏れなく適用されない。
service:
  pipelines:
    traces:
      receivers: [otlp]
      processors: [memory_limiter, k8sattributes, attributes, tail_sampling, batch]
      exporters: [otlp/tempo]
トップレベルの設定セクションは receivers、processors、exporters、connectors、extensions、service の六つである。connectorsはこの記事の例には登場しないが、あるパイプラインの出力を別のパイプラインの入力につなぐためのもので、tracesからmetricsを導出するといった構成に使われる。
運用中に読むべき自己メトリクス
Collector自身が出すメトリクスは、プロセスが生きているかではなく、データがどの段階で消えているかを教えてくれる。パイプラインは動いているのにバックエンドにデータが無い、という報告が来たときに最初に見る場所がここである。
curl -s http://localhost:8888/metrics | grep -E 'otelcol_(receiver|processor|exporter)_'
受信段階は otelcol_receiver_accepted_spans と otelcol_receiver_refused_spans の対で見る。metric_points と log_records の変種も同じ命名規則に従う。refused側が伸びていればCollectorが自ら拒否しているということなので、クライアントよりCollectorを先に疑う。
処理段階は otelcol_processor_incoming_items と otelcol_processor_outgoing_items で入った量と出た量を比べる。過去の記事によく出てくるドロップ系の名前は現在のドキュメントには無い。リリースによってプロセッサのメトリクス名が変わっているため、ダッシュボードをそのまま移植してパネルが空なら、まずメトリクス名を確認するのが早い。
送信段階は見るものが最も多い。otelcol_exporter_sent_spans と otelcol_exporter_send_failed_spans が成功と失敗、otelcol_exporter_enqueue_failed_spans はキューに入れることすらできなかった量である。otelcol_exporter_queue_size と otelcol_exporter_queue_capacity の比率は、バックエンドが受け取る速度が流入速度に追いついているかを示し、otelcol_exporter_in_flight_requests は今いくつの要求が応答待ちかを示す。プロセス自体は otelcol_process_uptime、otelcol_process_cpu_seconds、otelcol_process_memory_rss、otelcol_process_runtime_heap_alloc_bytes で見る。
service:
  telemetry:
    logs:
      level: INFO
    metrics:
      level: normal
telemetry配下のmetricsレベルは none、basic、normal、detailed から選ぶ。detailedに上げるとラベルの組み合わせが増えるため、カーディナリティのコストを払う覚悟があるときだけ使う。readers項目で自己メトリクスをどこへどう出すかも指定でき、logsレベルの既定値はINFOである。
アラートを一つだけ張るならキューのメトリクスを選ぶとよい。キューが容量に張り付いた状態が続けば、その次に来るのはほぼ必ず拒否と欠損だからである。
失敗パターンと切り分けの順序
症状は三つに分かれ、それぞれ確認の順序が違う。
一つ目は、データがまったく入ってこない場合。ドキュメントが挙げる原因はネットワーク構成の問題、receiver設定の誤り、クライアント設定の誤りの三つである。内側から外側へ順に詰める。まず一時的にdebug exporterを付けてreceiverまで到達したかを確認し、到達していれば問題は後段にある。
exporters:
  debug:
    verbosity: detailed
受信メトリクスがゼロなら、アプリケーションがまだ何も送っていないか、宛先を間違えて見ている。ここでよくある原因はgRPCとHTTPのポートを取り違えたケースである。SDKが4318へ送っているのにCollectorが4317しか開いていなければ接続自体が失敗し、エラーはアプリケーション側のログにしか残らず、Collector側には痕跡が出ない。
二つ目は、入ってはいるがバックエンドに見えない場合。ドキュメントは、Collectorのサイジングが足りず受信速度に処理と送信が追いつかないケースと、送信先が利用不能あるいは受け取りが遅すぎるケースを挙げている。まず送信失敗のメトリクスを見て、失敗が無いのに消えているならキューと拒否のメトリクスを見る。
curl -s http://localhost:8888/metrics | grep -E 'queue_size|queue_capacity|refused|send_failed'
この段階ではtail_samplingが原因であることも少なくない。ポリシーが意図より積極的だと、データは正常に送信されたのにバックエンドで特定のトレースだけが無い、という形になる。メトリクスは何の異常も報告しないので、パイプラインから一時的にtail_samplingを外して再現するか見るのが最も早い切り分けになる。
三つ目は、Collectorが周期的に落ちる場合。原因はメモリ逼迫であることが多く、ドキュメントもmemory_limiterプロセッサの設定を解決策として挙げている。すでに設定済みなのに落ちるなら、しきい値がコンテナのメモリ制限と噛み合っていないケースを疑う。コンテナ制限よりmemory_limiterのしきい値が高いと、プロセッサが介入する前にカーネルがプロセスを殺してしまう。
さらに深く追うときの道具は二つある。zPages拡張はポート55679で直近のトレースを見せるエンドポイントを提供し、pprof拡張はポート1777で実行中のCollectorをプロファイリングできるようにする。メモリがどこで増えているかを推測しているだけなら、先にpprofを付けたほうがよい。
Collectorを置かない判断
Collectorはタダではない。プロセスが一つ増え、そのプロセスが落ちればテレメトリが途切れる。バックエンドが一つだけで、SDKがそこへ直接送れて、サンプリングも属性加工も要らないなら、Collectorを入れるのは障害点を一つ増やす行為に近い。
AgentとGatewayを両方置く構成も同じである。ノードが数台で流量も大きくないなら、Gateway一層で十分足りる。Agent層が価値を持つのは、hostmetricsやfilelogのようにノードに張り付かなければ取れない信号があるときである。
tail_samplingはとりわけ慎重に導入すべき対象である。判断を下すには同じトレースのspanが一つのCollectorインスタンスに集まる必要があるため、Gatewayを複数レプリカに増やした瞬間にロードバランシングの方式まで一緒に設計しなければならない。この条件を満たす準備が無いなら、コスト削減目当てでtail_samplingを有効にするより、SDK側の確率サンプリングのほうがはるかに安全である。
最後に、Collectorはデータ品質の問題を直してくれない。計測が誤っていたりサービス名が不揃いだったりする状態でtransformプロセッサによる事後補正を積み上げ始めると、設定ファイルがアプリケーションのバグ一覧になる。その補正はアプリケーション側で直すのが筋である。
参考資料
- OpenTelemetry Collector — Configuration: https://opentelemetry.io/docs/collector/configuration/ (2026-08-16 確認)
- OpenTelemetry Collector — Internal telemetry: https://opentelemetry.io/docs/collector/internal-telemetry/ (2026-08-16 確認)
- OpenTelemetry Collector — Troubleshooting: https://opentelemetry.io/docs/collector/troubleshooting/ (2026-08-16 確認)
まとめ
OpenTelemetry Collectorパイプライン設計の要点:
- Agent + Gatewayパターン:ローカル収集+中央処理で効率的な運用
- テールサンプリング:エラー/遅いリクエストは100%、残りは確率的サンプリングでコスト削減
- Memory Limiterは必須:OOM防止のためのメモリ制限
- Processorの順序が重要:memory_limiter → sampling → batch の順序を推奨
- ベンダー中立:バックエンド変更時はExporterのみ交換
クイズ(6問)
Q1. OTel Collectorパイプラインの3つの構成要素は? Receiver、Processor、Exporter
Q2. Agent + Gatewayパターンでのそれぞれの役割は? Agent:各ノードでのローカル収集、Gateway:中央での処理/ルーティング/送信
Q3. テールサンプリングがヘッドサンプリングより優れている理由は? トレース全体を確認してからサンプリング判断するため、エラー/遅いリクエストを見逃さない
Q4. memory_limiter Processorをパイプラインの最初に配置する理由は? 受信データが多い場合にOOMを防止するため、最初にメモリをチェック
Q5. Collectorの自己メトリクスを確認する方法は? ポート8888の/metricsエンドポイントまたはzPages(ポート55679)
Q6. batch Processorのtimeoutとsend_batch_sizeの関係は? timeout時間に到達するかsend_batch_sizeに到達した場合にバッチを送信(先に発生した条件)
クイズ
Q1: 「OpenTelemetry Collectorパイプライン設計実践ガイド —
Receiver、Processor、Exporter」の主なトピックは何ですか?
OpenTelemetry Collectorのアーキテクチャからパイプライン設計、Receiver/Processor/Exporter設定、プロダクション環境のデプロイパターンまで実践的な例で解説します。
Q2: OTel Collectorアーキテクチャについて説明してください。
パイプライン構造 Collectorデプロイパターン
Q3: インストールの主な手順は何ですか?
Kubernetes(Helm) Docker
Q4: Receiver詳細の主な特徴は何ですか?
OTLP Receiver Filelog Receiver(ログファイル収集)
Q5: Processor詳細はどのように機能しますか?
テールサンプリング(重要!) Transform Processor