
- Introduction
- OTel Collector Architecture
- Installation
- Pipeline Configuration
- Receiver Details
- Processor Details
- Kubernetes Deployment
- Troubleshooting
- Pre-Deployment Checks: Config File and Components
- What Processor Order Actually Changes
- The Self Metrics Worth Watching
- Failure Modes and the Order to Check Them
- When Not to Run a Collector
- References
- Conclusion
- Quiz
Introduction
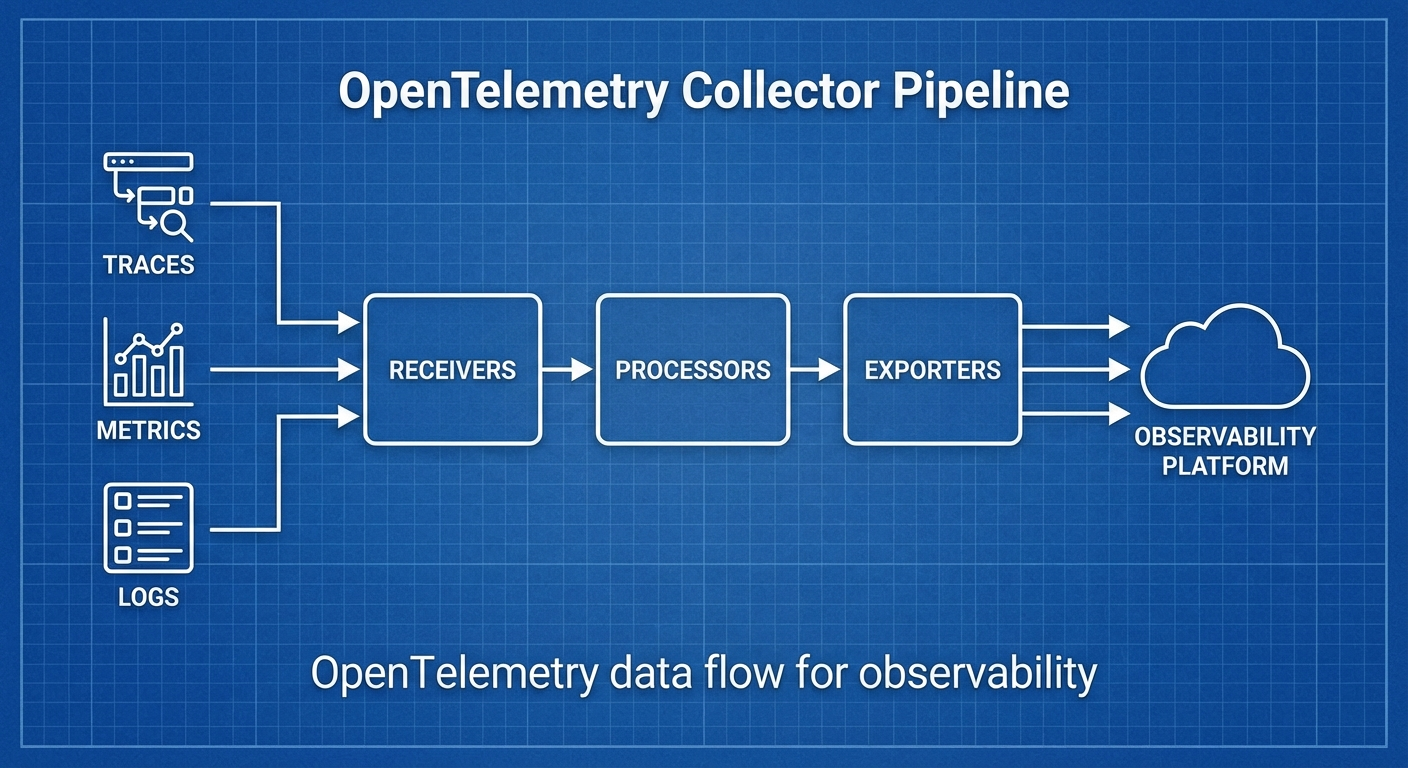
In microservice environments, unified collection and processing of Traces, Metrics, and Logs is at the core of Observability. The OpenTelemetry Collector is a vendor-neutral telemetry pipeline that collects data from various sources and sends it to the desired backends.
In this article, we explore the OTel Collector architecture and cover pipeline design for production environments.
OTel Collector Architecture
Pipeline Structure
# Data Flow
# Receiver → Processor → Exporter
#
# Receiver: Data collection (OTLP, Jaeger, Prometheus, Fluentd, etc.)
# Processor: Data processing (filtering, transformation, batching, sampling)
# Exporter: Data transmission (OTLP, Jaeger, Prometheus, Loki, etc.)
#
# Multiple pipelines can be configured in a single Collector:
# - traces pipeline
# - metrics pipeline
# - logs pipeline
Collector Deployment Patterns
# Pattern 1: Agent (Sidecar/DaemonSet)
# Deployed on each node/Pod, collects locally

# Pattern 2: Gateway (Centralized)
# Deployed as an independent service in the cluster, centralizes traffic

# Pattern 3: Agent + Gateway (Recommended)
# Agent collects locally → Gateway handles central processing/routing
Installation
Kubernetes (Helm)
# Install OpenTelemetry Operator
helm repo add open-telemetry https://open-telemetry.github.io/opentelemetry-helm-charts
helm repo update

# Install Collector (DaemonSet mode)
helm install otel-collector open-telemetry/opentelemetry-collector \
  --namespace observability \
  --create-namespace \
  --values collector-values.yaml
Docker
docker run -d --name otel-collector \
  -p 4317:4317 \
  -p 4318:4318 \
  -p 8888:8888 \
  -v $(pwd)/otel-collector-config.yaml:/etc/otelcol/config.yaml \
  otel/opentelemetry-collector-contrib:0.96.0
Pipeline Configuration
Basic Configuration Structure
# otel-collector-config.yaml
receivers:
  otlp:
    protocols:
      grpc:
        endpoint: 0.0.0.0:4317
      http:
        endpoint: 0.0.0.0:4318

processors:
  batch:
    timeout: 5s
    send_batch_size: 1000
    send_batch_max_size: 1500

exporters:
  debug:
    verbosity: detailed

service:
  pipelines:
    traces:
      receivers: [otlp]
      processors: [batch]
      exporters: [debug]
    metrics:
      receivers: [otlp]
      processors: [batch]
      exporters: [debug]
    logs:
      receivers: [otlp]
      processors: [batch]
      exporters: [debug]
Production Pipeline
# production-config.yaml
receivers:
  # OTLP (sent from application SDKs)
  otlp:
    protocols:
      grpc:
        endpoint: 0.0.0.0:4317
        max_recv_msg_size_mib: 4
      http:
        endpoint: 0.0.0.0:4318
        cors:
          allowed_origins: ['*']

  # Prometheus scraping
  prometheus:
    config:
      scrape_configs:
        - job_name: 'kubernetes-pods'
          kubernetes_sd_configs:
            - role: pod
          relabel_configs:
            - source_labels: [__meta_kubernetes_pod_annotation_prometheus_io_scrape]
              action: keep
              regex: true

  # Host metrics
  hostmetrics:
    collection_interval: 30s
    scrapers:
      cpu: {}
      memory: {}
      disk: {}
      network: {}
      load: {}

  # Kubernetes events
  k8s_events:
    namespaces: [default, production]

processors:
  # Batching
  batch:
    timeout: 5s
    send_batch_size: 1000

  # Memory limiting
  memory_limiter:
    check_interval: 1s
    limit_mib: 1500
    spike_limit_mib: 512

  # Resource information enrichment
  resourcedetection:
    detectors: [env, system, docker, gcp, aws, azure]
    timeout: 5s

  # K8s metadata enrichment
  k8sattributes:
    auth_type: serviceAccount
    extract:
      metadata:
        - k8s.namespace.name
        - k8s.deployment.name
        - k8s.pod.name
        - k8s.node.name

  # Remove unnecessary attributes
  attributes:
    actions:
      - key: http.request.header.authorization
        action: delete
      - key: db.statement
        action: hash # Hash sensitive queries

  # Tail sampling (traces only)
  tail_sampling:
    decision_wait: 10s
    num_traces: 100000
    policies:
      - name: error-policy
        type: status_code
        status_code:
          status_codes: [ERROR]
      - name: slow-policy
        type: latency
        latency:
          threshold_ms: 1000
      - name: probabilistic-policy
        type: probabilistic
        probabilistic:
          sampling_percentage: 10

  # Filtering
  filter:
    metrics:
      exclude:
        match_type: regexp
        metric_names:
          - 'go_.*'
          - 'process_.*'

exporters:
  # Traces → Tempo
  otlp/tempo:
    endpoint: tempo.observability.svc:4317
    tls:
      insecure: true

  # Metrics → Prometheus/Mimir
  prometheusremotewrite:
    endpoint: http://mimir.observability.svc:9009/api/v1/push
    tls:
      insecure: true
    resource_to_telemetry_conversion:
      enabled: true

  # Logs → Loki
  loki:
    endpoint: http://loki.observability.svc:3100/loki/api/v1/push
    default_labels_enabled:
      exporter: true
      job: true

  # Debug (for troubleshooting)
  debug:
    verbosity: basic

extensions:
  # Health check
  health_check:
    endpoint: 0.0.0.0:13133

  # Self metrics
  zpages:
    endpoint: 0.0.0.0:55679

  # pprof (profiling)
  pprof:
    endpoint: 0.0.0.0:1777

service:
  extensions: [health_check, zpages, pprof]

  pipelines:
    traces:
      receivers: [otlp]
      processors:
        [memory_limiter, resourcedetection, k8sattributes, attributes, tail_sampling, batch]
      exporters: [otlp/tempo]

    metrics:
      receivers: [otlp, prometheus, hostmetrics]
      processors: [memory_limiter, resourcedetection, k8sattributes, filter, batch]
      exporters: [prometheusremotewrite]

    logs:
      receivers: [otlp, k8s_events]
      processors: [memory_limiter, resourcedetection, k8sattributes, attributes, batch]
      exporters: [loki]

  telemetry:
    logs:
      level: info
    metrics:
      address: 0.0.0.0:8888
Receiver Details
OTLP Receiver
receivers:
  otlp:
    protocols:
      grpc:
        endpoint: 0.0.0.0:4317
        max_recv_msg_size_mib: 4
        keepalive:
          server_parameters:
            max_connection_idle: 11s
            max_connection_age: 30s
      http:
        endpoint: 0.0.0.0:4318
Filelog Receiver (Log File Collection)
receivers:
  filelog:
    include:
      - /var/log/pods/*/*/*.log
    exclude:
      - /var/log/pods/*/otel-collector*/*.log
    start_at: beginning
    include_file_path: true
    operators:
      - type: router
        routes:
          - output: parse_json
            expr: 'body matches "^\\{"'
          - output: parse_plain
            expr: 'body matches "^[^{]"'
      - id: parse_json
        type: json_parser
        timestamp:
          parse_from: attributes.timestamp
          layout: '%Y-%m-%dT%H:%M:%S.%fZ'
      - id: parse_plain
        type: regex_parser
        regex: '^(?P<timestamp>\S+) (?P<level>\S+) (?P<message>.*)'
Processor Details
Tail Sampling (Critical!)
processors:
  tail_sampling:
    decision_wait: 10s
    num_traces: 100000
    expected_new_traces_per_sec: 1000
    policies:
      # Collect 100% of errors
      - name: errors
        type: status_code
        status_code:
          status_codes: [ERROR]

      # Collect 100% of slow requests over 1 second
      - name: slow-traces
        type: latency
        latency:
          threshold_ms: 1000

      # Collect 100% for specific services
      - name: critical-services
        type: string_attribute
        string_attribute:
          key: service.name
          values: [payment-service, auth-service]

      # Collect only 5% of the rest
      - name: probabilistic
        type: probabilistic
        probabilistic:
          sampling_percentage: 5

      # Composite policy
      - name: composite-policy
        type: composite
        composite:
          max_total_spans_per_second: 1000
          policy_order: [errors, slow-traces, critical-services, probabilistic]
          rate_allocation:
            - policy: errors
              percent: 30
            - policy: slow-traces
              percent: 30
            - policy: critical-services
              percent: 20
            - policy: probabilistic
              percent: 20
Transform Processor
processors:
  transform:
    trace_statements:
      - context: span
        statements:
          # Add attribute
          - set(attributes["deployment.environment"], "production")
          # Transform attribute
          - replace_pattern(attributes["http.url"], "password=\\w+", "password=***")
          # Conditional processing
          - set(attributes["error.category"], "timeout") where attributes["error.type"] == "DeadlineExceeded"

    metric_statements:
      - context: datapoint
        statements:
          - set(attributes["env"], "prod")

    log_statements:
      - context: log
        statements:
          # Extract information from log body
          - set(attributes["user_id"], ExtractPatterns(body, "user_id=(?P<user_id>\\w+)"))
Kubernetes Deployment
Agent (DaemonSet) + Gateway Pattern
# agent-config.yaml (DaemonSet)
apiVersion: opentelemetry.io/v1beta1
kind: OpenTelemetryCollector
metadata:
  name: otel-agent
  namespace: observability
spec:
  mode: daemonset
  config:
    receivers:
      otlp:
        protocols:
          grpc:
            endpoint: 0.0.0.0:4317
      hostmetrics:
        collection_interval: 30s
        scrapers:
          cpu: {}
          memory: {}

    processors:
      memory_limiter:
        limit_mib: 512
      batch:
        timeout: 5s

    exporters:
      # Send to Gateway
      otlp:
        endpoint: otel-gateway.observability.svc:4317
        tls:
          insecure: true

    service:
      pipelines:
        traces:
          receivers: [otlp]
          processors: [memory_limiter, batch]
          exporters: [otlp]
        metrics:
          receivers: [otlp, hostmetrics]
          processors: [memory_limiter, batch]
          exporters: [otlp]
---
# gateway-config.yaml (Deployment)
apiVersion: opentelemetry.io/v1beta1
kind: OpenTelemetryCollector
metadata:
  name: otel-gateway
  namespace: observability
spec:
  mode: deployment
  replicas: 3
  config:
    receivers:
      otlp:
        protocols:
          grpc:
            endpoint: 0.0.0.0:4317

    processors:
      memory_limiter:
        limit_mib: 2048
      tail_sampling:
        decision_wait: 10s
        policies:
          - name: errors
            type: status_code
            status_code:
              status_codes: [ERROR]
          - name: probabilistic
            type: probabilistic
            probabilistic:
              sampling_percentage: 10
      batch:
        timeout: 10s
        send_batch_size: 5000

    exporters:
      otlp/tempo:
        endpoint: tempo.observability.svc:4317
        tls:
          insecure: true
      prometheusremotewrite:
        endpoint: http://mimir.observability.svc:9009/api/v1/push
      loki:
        endpoint: http://loki.observability.svc:3100/loki/api/v1/push

    service:
      pipelines:
        traces:
          receivers: [otlp]
          processors: [memory_limiter, tail_sampling, batch]
          exporters: [otlp/tempo]
        metrics:
          receivers: [otlp]
          processors: [memory_limiter, batch]
          exporters: [prometheusremotewrite]
        logs:
          receivers: [otlp]
          processors: [memory_limiter, batch]
          exporters: [loki]
Troubleshooting
Checking Self Metrics
# Collector self metrics (port 8888)
curl http://localhost:8888/metrics | grep otelcol

# Key metrics:
# otelcol_receiver_accepted_spans - Number of accepted spans
# otelcol_receiver_refused_spans - Number of refused spans
# otelcol_processor_dropped_spans - Number of dropped spans
# otelcol_exporter_sent_spans - Number of sent spans
# otelcol_exporter_send_failed_spans - Number of failed spans
Debugging with zPages
# http://localhost:55679/debug/tracez — View recent traces
# http://localhost:55679/debug/pipelinez — View pipeline status
Pre-Deployment Checks: Config File and Components
A single misaligned line of YAML stops the Collector from starting at all. The trouble is that most teams only find this out after watching a CrashLoopBackOff in the cluster. Pipeline changes are far cheaper to validate locally, before the commit.
# Parses the config, checks it against each component's schema, and exits
otelcol validate --config=customconfig.yaml

# Prints the components actually built into this binary, with stability levels
otelcol components
otelcol validate opens no ports and receives no data. It only reads the config, which makes it a good fit for CI. Extract the config portion out of a Helm-rendered ConfigMap, hand it to this command, and you catch a processor that does not exist in the pipeline or a mistyped exporter suffix before anything is deployed.
otelcol components is less well known but needed more often in practice. When a component named in the config is absent from the running binary, the Collector dies with an unknown-type style error, and the first instinct is to suspect a typo. The real cause is far more often a different distribution. Which components are compiled in varies from build to build, so before copying a component name out of a blog post or a doc page, confirm it exists with this command. The output also carries stability levels, so you can decide in the same place whether a production pipeline is leaning on an alpha component.
Values that differ per environment belong in environment variable substitution, not in duplicate config files. The Collector supports substitution with an env prefix, and a default value can be attached with a colon and a hyphen. If a literal dollar sign is needed inside a value, it is escaped by writing the dollar sign twice.
exporters:
  otlp/backend:
    endpoint: ${env:OTLP_ENDPOINT}
    headers:
      authorization: ${env:OTLP_TOKEN:-}
Individual values can also be overridden on the command line. Nested keys are separated with a double colon, as in --set outer::inner=value, and passing --config more than once merges the configs. That is enough to layer per-environment fragments on top of one shared base without copying files.
What Processor Order Actually Changes
The docs are blunt about it: the order of the processors in a pipeline determines the order of the processing operations applied to the signal. It is a short sentence with large operational consequences.
memory_limiter goes first because it does not thin the data flowing onward — it refuses data outright once memory pressure is detected, pushing backpressure back upstream. Placed later, it only refuses after parsing and transformation have already consumed the memory, so the protection is gone.
tail_sampling must come before batch. Sampling decisions are made per trace, and if batching happens first, spans from the same trace scatter across different batches, leaving the decision to be made on an incomplete picture. batch, conversely, is almost always last. Batching exists for transport efficiency, so anything appended after it forces the batch to be unpacked and repacked.
Where filter and attributes sit is a cost question. The earlier you drop data you intend to discard, the less every later stage has to process. Redaction, however, works the other way around. Processors like k8sattributes can introduce new attributes, so deletion or hashing has to come after them to apply to everything.
service:
  pipelines:
    traces:
      receivers: [otlp]
      processors: [memory_limiter, k8sattributes, attributes, tail_sampling, batch]
      exporters: [otlp/tempo]
There are six top-level config sections: receivers, processors, exporters, connectors, extensions, and service. connectors does not appear in the examples above, but it wires one pipeline's output into another pipeline's input, which is how you derive metrics from traces.
The Self Metrics Worth Watching
The Collector's own metrics do not tell you whether the process is alive; they tell you at which stage data disappears. When a report arrives saying the pipeline is up but nothing reaches the backend, this is the first place to look.
curl -s http://localhost:8888/metrics | grep -E 'otelcol_(receiver|processor|exporter)_'
Read the receive stage as a pair: otelcol_receiver_accepted_spans against otelcol_receiver_refused_spans. The metric_points and log_records variants follow the same naming rule. If the refused side is climbing, the Collector itself is doing the refusing, so suspect the Collector before the client.
For the processing stage, compare otelcol_processor_incoming_items against otelcol_processor_outgoing_items. The drop-style names that appear in older write-ups are not on the current page. Processor metric names changed across releases, so if a dashboard was lifted from elsewhere and a panel is empty, check the metric name first.
The export stage has the most to look at. otelcol_exporter_sent_spans and otelcol_exporter_send_failed_spans are success and failure; otelcol_exporter_enqueue_failed_spans is the volume that never even made it into the queue. The ratio of otelcol_exporter_queue_size to otelcol_exporter_queue_capacity shows whether the backend is draining as fast as data arrives, and otelcol_exporter_in_flight_requests shows how many requests are waiting on a response right now. The process itself is covered by otelcol_process_uptime, otelcol_process_cpu_seconds, otelcol_process_memory_rss, and otelcol_process_runtime_heap_alloc_bytes.
service:
  telemetry:
    logs:
      level: INFO
    metrics:
      level: normal
The metrics level under telemetry is one of none, basic, normal, or detailed. Raising it to detailed multiplies label combinations, so use it only when you are ready to pay the cardinality cost. The readers key controls where and how the self metrics are exported, and the default logs level is INFO.
If you only get to set one alert, make it a queue alert. A queue pinned at capacity is almost always followed by refusals and loss.
Failure Modes and the Order to Check Them
Symptoms split three ways, and each has a different order of investigation.
First, no data arrives at all. The docs list three causes: a network configuration issue, an incorrect receiver configuration, and an incorrect client configuration. Work from the inside out. Attach a debug exporter temporarily to establish whether anything reached the receiver; if it did, the problem is downstream.
exporters:
  debug:
    verbosity: detailed
If the receive metrics are zero, either the application has not sent anything yet or it is aiming at the wrong address. The common cause here is swapping the gRPC and HTTP ports. When the SDK sends to 4318 while the Collector only opened 4317, the connection fails outright, the error is logged only on the application side, and the Collector shows no trace of it.
Second, data arrives but never shows up in the backend. The docs cite an undersized Collector that cannot process and export as fast as it receives, and a destination that is unavailable or accepting data too slowly. Check the send-failure metrics first; if there are no failures and data still vanishes, look at the queue and refusal metrics.
curl -s http://localhost:8888/metrics | grep -E 'queue_size|queue_capacity|refused|send_failed'
tail_sampling is a frequent culprit at this point. A policy that is more aggressive than intended produces the shape where data was transmitted normally but specific traces are simply absent in the backend. No metric reports anything wrong, so the fastest way to separate the cases is to pull tail_sampling out of the pipeline briefly and see whether the symptom persists.
Third, the Collector dies periodically. Memory pressure is the usual cause, and the docs point at the memory_limiter processor as the fix. If it is already configured and the process still dies, suspect a limit that does not line up with the container memory limit. When the memory_limiter threshold sits above the container limit, the kernel kills the process before the processor ever intervenes.
Two tools take you deeper. The zPages extension serves an endpoint on port 55679 showing recent traces, and the pprof extension on port 1777 lets you profile the Collector as it runs. If you are only guessing where memory is growing, attach pprof first.
When Not to Run a Collector
A Collector is not free. It is one more process, and when it dies, telemetry stops. If you have exactly one backend, the SDK can ship to it directly, and you need no sampling or attribute work, adding a Collector mostly adds a failure point.
The same applies to running both an Agent and a Gateway. With a handful of nodes and modest traffic, a single Gateway tier is enough. The Agent tier earns its place when you need node-local signals — hostmetrics or filelog, the data you can only obtain by sitting on the node.
tail_sampling in particular deserves caution. Making a decision requires every span of a trace to land on the same Collector instance, so the moment you scale the Gateway past one replica you must also design the load balancing. If you are not ready to satisfy that condition, probabilistic sampling in the SDK is far less risky than switching on tail_sampling to save money.
Finally, a Collector will not fix data quality. If instrumentation is wrong or service names are inconsistent, piling up transform-processor corrections turns the config file into a list of application bugs. Those belong in the application.
References
- OpenTelemetry Collector — Configuration: https://opentelemetry.io/docs/collector/configuration/ (checked 2026-08-16)
- OpenTelemetry Collector — Internal telemetry: https://opentelemetry.io/docs/collector/internal-telemetry/ (checked 2026-08-16)
- OpenTelemetry Collector — Troubleshooting: https://opentelemetry.io/docs/collector/troubleshooting/ (checked 2026-08-16)
Conclusion
Key points for OpenTelemetry Collector pipeline design:
- Agent + Gateway pattern: Efficient operations with local collection + centralized processing
- Tail Sampling: Cost reduction with 100% collection for errors/slow requests, probabilistic sampling for the rest
- Memory Limiter is essential: Memory limits to prevent OOM
- Processor order matters: Recommended order is memory_limiter then sampling then batch
- Vendor neutral: Only swap the Exporter when changing backends
Quiz (6 Questions)
Q1. What are the three components of an OTel Collector pipeline? Receiver, Processor, Exporter
Q2. What are the roles of Agent and Gateway in the Agent + Gateway pattern? Agent: Local collection on each node, Gateway: Central processing/routing/transmission
Q3. Why is Tail Sampling better than Head Sampling? It makes sampling decisions after seeing the complete trace, so errors/slow requests are never missed
Q4. Why should the memory_limiter Processor be placed first in the pipeline? To check memory first and prevent OOM when receiving large volumes of data
Q5. How do you check the Collector's self metrics? Via the /metrics endpoint on port 8888 or zPages (port 55679)
Q6. What is the relationship between the batch Processor's timeout and send_batch_size? The batch is sent when either the timeout expires or the send_batch_size is reached (whichever comes first)
Quiz
Q1: What is the main topic covered in "OpenTelemetry Collector Pipeline Design Practical Guide —
Receiver, Processor, Exporter"?
Covers everything from OpenTelemetry Collector architecture to pipeline design, Receiver/Processor/Exporter configuration, and production deployment patterns with practical examples.
Q2: Describe the OTel Collector Architecture.
Pipeline Structure Collector Deployment Patterns
Q3: What are the key steps for Installation?
Kubernetes (Helm) Docker
Q4: What are the key steps for Pipeline Configuration?
Basic Configuration Structure Production Pipeline
Q5: How does Receiver Details work?
OTLP Receiver Filelog Receiver (Log File Collection)